CountEmissions 3: CPI, the smart new indicator (1)
The COFRET allocation calculations that form the basis of ISO-14083 consists of three parts:
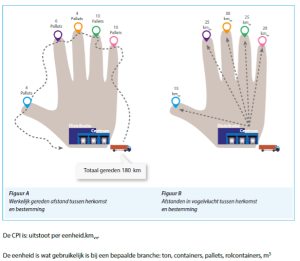
First calculate all the transport performances of the trip and add up to the total
- A transport performance is a measure, per shipment, of the added value:
- How big is each shipment?
- How far away will it be taken (origin-destination)?
- This is virtually the same as how cost prices are calculated in advance.
- The distance is the bird’s-eye distance between origin and destination
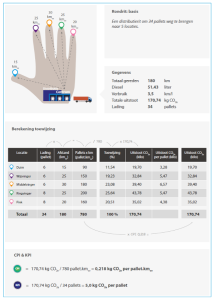
Divide that sum by the total emissions of the journey
- This division produces the CPI (COFRET performance indicator) for this journey
- CPI = the average emissions per unit of performance
Then calculate the emissions per shipment
This is explained further in the infographics below. The background can be downloaded here. The CPI turns out to be a very smart and useful indicator. But more about that in a next post .
Calculating a CPI is very similar to how costs for transport to customers are calculated: the net distance between origin and destination is a measure of the price (and not whether a parcel has been in the car for the entire round trip and is delivered just before the return ).
The CPI turns out to be a very smart and useful indicator, because:
- The CPI is much better at predicting emissions from the transport of a shipment than the classic “emission intensity factors”
- It is very easy to predict emissions per shipment with a CPI and consignment note information
- The CPI shows the logistics effectiveness of the combination of shipper and carrier, expressed in energy consumption and subsequently in CO2 emissions. And it turns out to be close within segments and to differ considerably between segments.
- The CPI is a kind of subsequent calculation of cost prices: what have you actually achieved?
In this post we explain the principle, the rest is about one of the useful and smart applications.
(Click on the images for full size)

